
People drive significantly less in European cities with a metro system than in cities that only have trams or no rail-based public transport at all. This is shown by a new study from the Complexity Science Hub (CSH), published in Nature Cities.
Share of Car Trips: 37% Versus 50%
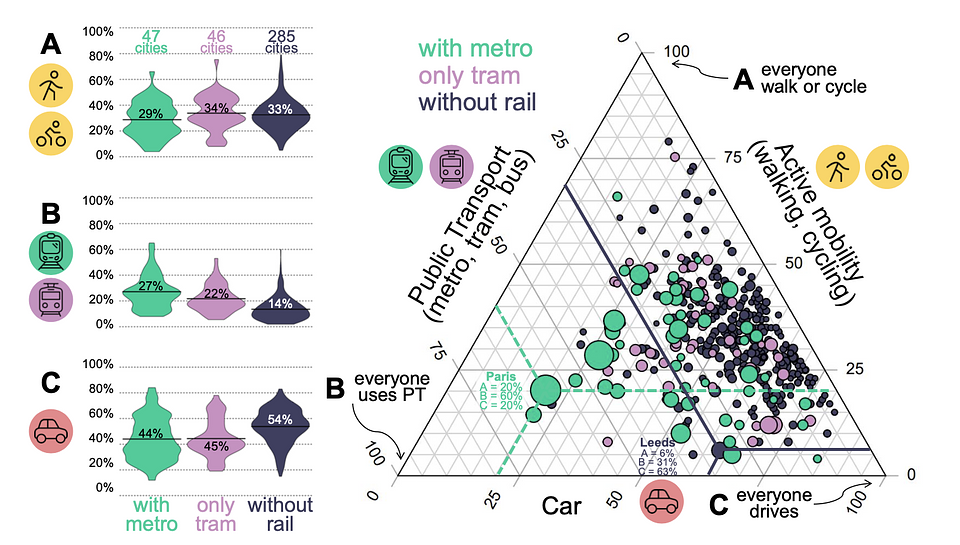
Commuting behaviour across 378 cities in Europe: Depending on whether cities have a metro system, only a tram network, or no rail-based network, the average commuting patterns, weighted by population, are shown on the left, across three mobility categories—active mobility (A), public transport (B), and motorized private transport (C). The triangular chart on the right shows the commute patterns of residents in all 378 cities. Each circle represents one city, with circle size indicating population and circle color indicating whether the city has a metro system, a tram network, or neither.
Larger Cities, Larger Effect
Small Changes with Big Impact: The Example of Vienna
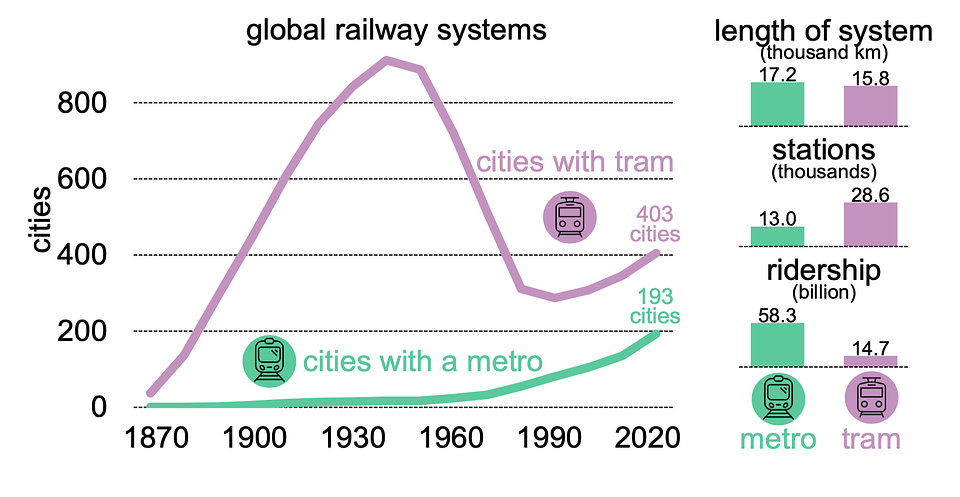
Global railway systems by metro and tram coverage, length, stations, and ridership: The number of cities with a metro and tram system between 1870 and 2020 can be seen on the left. On the right are the global length of the system, the number of stations (or stops), and the number of passengers each year. Based on data from the International Association of Public Transport.